Infrastructure
How to test CPU, Memory and File System Performance using Sysbench
Sysbecnch is mainly used for testing database performance, but it is a more generic tool. It can also be used to run CPU, Memory, and File System performance tests. In this post, I will give a quick introduction to the tool. The purpose of this post is just to introduce Sysbench commands to the user.
Every test has three steps. Not all tests require these three steps. In this article, we will use it only for testing file system performance.
- Prepare: Setup up required data/files before running the tests. For example, when running a database performance test, you may want to set up test data.
- Run: Perform the actual test.
- Clean up: Perform the clean up work after required.
1. Install Sysbench
1.1 In Mac
# Install Sysbench
brew install sysbench

# Verify Installation by running sysbench
% sysbench --help
Usage:
  sysbench [options]... [testname] [command]

Commands implemented by most tests: prepare run cleanup help
1.2 Run as a container
docker run -it severalnines/sysbench sh2. Run CPU Performance Test
You can execute simple CPU performance tests using “sysbench cpu run” command.
sysbench cpu --cpu-max-prime=500 run2.1 What the test is doing internally?
Sysbench tries to keep the CPU busy by running a code, measured as an event, that will find out how many prime numbers are there between 3 and the “cpu-max-prime”. If the cpu-max-prime is very small, say 10, then it will be very quick to test all primes between 3-10, thus the test event duration will be very less. If the cpu-max-prime is very high, say 1000000, then it will take quite some time to test all primes between 3-1000000, thus the test event duration will be very high.
Below is the pseudocode (as of this writing)
sumEvents = 0
startTime = timeNow;

while(duration < testDuration || sumEvents < totalNoOfEvents) {
   // Event Start

   // Figure out all primes between 3 and cpu-max-prime
   for(i=3; i < cpuMaxPrime;i++) {
      // Run the primality test for i
   }

   sumEvents++;
   // Event End
}

endTime = timeNow - startTime;
You can specify how many times the above test should be executed (–events arg) or specify how much duration the tests should be repeated (–time arg).
2.2 How to interpret the Sysbench CPU test results?
So using Sysbench CPU performance tests, you can identify,
- How many primality tests you can run in a given duration? You have to check the events per second metric.
- How much time it takes to run ‘N’ primality tests? You have to check the excecution time metric.
Unless you want to dig deeper into the internals of CPU Architecture, I will suggest to keep cpu-max-prime constant accross any tests you are running. 500 seems to be a good number, so that the for loop is running very tight, and at the same time task completes faster.
2.3 Sample test runs and result in my Mac
Below is the result of executing cpu tests with one thread in my Mac.
% sysbench cpu --cpu-max-prime=500 run
sysbench 1.0.20 (using system LuaJIT 2.1.0-beta3)

Running the test with following options:
Number of threads: 1
Initializing random number generator from current time


Prime numbers limit: 500

Initializing worker threads...

Threads started!

CPU speed:
    events per second: 4471958.12

General statistics:
    total time:                          10.0000s
    total number of events:              44725028

Latency (ms):
         min:                                    0.00
         avg:                                    0.00
         max:                                    0.14
         95th percentile:                        0.00
         sum:                                 3780.48

Threads fairness:
    events (avg/stddev):           44725028.0000/0.00
    execution time (avg/stddev):   3.7805/0.00
By default, the tests use 1 thread. You can increase the number of threads using –threads option. I executed the above tests with 30 threads and obtained below results.
% sysbench cpu --cpu-max-prime=500 --threads=8  run
sysbench 1.0.20 (using system LuaJIT 2.1.0-beta3)

Running the test with following options:
Number of threads: 8
Initializing random number generator from current time


Prime numbers limit: 500

Initializing worker threads...

Threads started!

CPU speed:
    events per second: 33212587.08

General statistics:
    total time:                          10.0002s
    total number of events:              332172933

Latency (ms):
         min:                                    0.00
         avg:                                    0.00
         max:                                    1.50
         95th percentile:                        0.00
         sum:                                21093.91

Threads fairness:
    events (avg/stddev):           41521616.6250/177488.98
    execution time (avg/stddev):   2.6367/0.02
2.3 Double check your numbers are correct
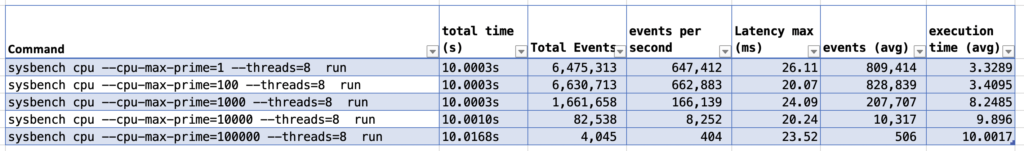
As of this writing, I noticed a bug in the Sysbench version in mac. If I leave the default time to 10 seconds, then there is no impact on the cpu-max-prime parameters.
I expect the events per second to be very less when the cpu-max-prime value is very high because the CPU has to run a huge number of primality tests. But this did not happen and the events per second were approximately the same for any “cpu-max-prime”.
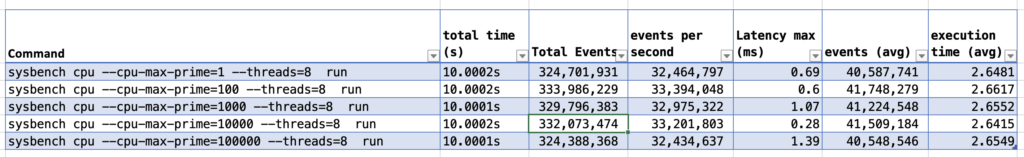
I ran the same tests in a Linux container with an older Sysbench version and I got the expected results.
3. Run Memory Performance Test
Sysbench can run simple memory tests using “sysbench memory run” command. Internally it will perform sequential & random memory operations (read & write). This command will accept the below params.
sysbench memory runBelow are the various test parameters available.
| Parameter | Description |
| memory-block-size | Size of a memory block for the test. It must be a power of 2. Default 1KB (1024). |
| memory-total-size | The total size of data to transfer. Default is 100G. |
| memory-scope | Memory access scope (global/local). Default global. |
| memory-oper | Type of memory operations (read/write/none). Default Write. |
| memory-access-mode | Memory access mode (seq/rnd). Default seq. |
3.1 What the test is doing internally?
First, the required amount of threads are created and initialized. All memory operations are performed on a block of memory specified by memory-block-size (1KB block by default).
If the memory scope is global, then all threads share the same memory block. If the memory scope is local, then each thread gets its own memory block.
Increasing the value of “memory-block-size” will increase the amount of work done in each loop/event. You can leave the default value of 1KB.
# Each Thread

sumEvents = 0
startTime = timeNow;

# totalMemoryOpSizePerThread = Total memory operation size / number of threads
# Ex: 1000GB/50 Threads = 20GB Per thread
# totalNoOfEventsPerThread = totalMemoryOpSizePerThread / memory block size
# 20GB/1KB = 20 Million Events

while(duration < testDuration || sumEvents < totalNoOfEventsPerThread) {
   // Event Start

   // Perform Memory Test on a block of data
   // Sequential Read: Read each INT from the memory block sequentially
   // Sequential Write: Write INT sequentially to a memory block
   // Random Read: Read INTs from random locations in the memory block
   // Random Write: Write INTs into random locations in the memory block

   sumEvents++;
   // Event End
}

endTime = timeNow - startTime;
3.2 Sample memory performance tests and results
# sequential memory write

% sysbench memory --memory-total-size=1000G --threads=50 --memory-access-mode=seq --memory-oper=write --verbosity=5 --time=60 run
sysbench 1.0.20 (using system LuaJIT 2.1.0-beta3)

Running the test with following options:
Number of threads: 50
Initializing random number generator from current time


Running memory speed test with the following options:
  block size: 1KiB
  total size: 1024000MiB
  operation: write
  scope: global

Initializing worker threads...

Threads started!

Done.

Total operations: 1028272067 (17137201.43 per second)

1004171.94 MiB transferred (16735.55 MiB/sec)


General statistics:
    total time:                          60.0010s
    total number of events:              1028272067

Latency (ms):
         min:                                    0.00
         avg:                                    0.00
         max:                                   73.44
         95th percentile:                        0.00
         sum:                              2141683.61

Threads fairness:
    events (avg/stddev):           20565441.3400/47586.60
    execution time (avg/stddev):   42.8337/0.43
# 1KB Block Reads
sysbench memory --memory-total-size=1000G --threads=50 --memory-block-size=1024 --memory-access-mode=seq --memory-oper=read --memory-scope=global --time=60 run

sysbench memory --memory-total-size=1000G --threads=50 --memory-block-size=1024 --memory-access-mode=seq --memory-oper=read --memory-scope=local --time=60 run

sysbench memory --memory-total-size=1000G --threads=50 --memory-block-size=1024 --memory-access-mode=rnd --memory-oper=read --memory-scope=global --time=1800 run

sysbench memory --memory-total-size=1000G --threads=50 --memory-block-size=1024 --memory-access-mode=rnd --memory-oper=read --memory-scope=local --time=600 run


# 1KB Block Writes
sysbench memory --memory-total-size=1000G --threads=50 --memory-block-size=1024 --memory-access-mode=seq --memory-oper=write --memory-scope=global --time=60 run

sysbench memory --memory-total-size=1000G --threads=50 --memory-block-size=1024 --memory-access-mode=seq --memory-oper=write --memory-scope=local --time=60 run

sysbench memory --memory-total-size=1000G --threads=50 --memory-block-size=1024 --memory-access-mode=rnd --memory-oper=write --memory-scope=global --time=1800 run

sysbench memory --memory-total-size=1000G --threads=50 --memory-block-size=1024 --memory-access-mode=rnd --memory-oper=write --memory-scope=local --time=600 run
And this is the result of running Sysbench memory performance tests with above configurations.
| Threads | Total Data | Block Size | Scope | Operation | Mode | Total Time | MiB/Sec |
|---|---|---|---|---|---|---|---|
| 50 | 1000G | 1KB | Global | Read | Sequential | 26.7255s | 38313.04 |
| 50 | 1000G | 1KB | Local | Read | Sequential | 28.1206s | 36412.55 |
| 50 | 1000G | 1KB | Global | Read | Random | 136.1686s | 7519.98 |
| 50 | 1000G | 1KB | Local | Read | Random | 142.3527s | 7193.3 |
| 50 | 1000G | 1KB | Global | Write | Sequential | 54.0600s | 18941.5 |
| 50 | 1000G | 1KB | Local | Write | Sequential | 32.0047s | 31993.94 |
| 50 | 1000G | 1KB | Global | Write | Random | 586.8338s | 1744.95 |
| 50 | 1000G | 1KB | Local | Write | Random | 116.9689s | 8754.36 |
3. Run FileSystem Performance Test
File system performance can be run using the command,
mkdir filetest
cd filetest
sysbench fileio --file-test-mode=seqwr prepare
sysbench fileio --file-test-mode=seqwr run
sysbench fileio --file-test-mode=seqwr cleanup
The tests transfer a specified (file-total-size) amount of data to and from the file system, with various configurations and track performance metrics.
The data can be written to a single file, or written to multiple files, specified by the “file-num” argument.
Also, you can employ a single thread or multiple threads to transfer the data (threads).
What the test is doing?
The prepare command will create the necessary files for the test. You can see the test files in your current working directory.
Sample test runs and results
# Prepare

% sysbench fileio --file-test-mode=seqwr --file-num=8 prepare
sysbench 1.0.20 (using system LuaJIT 2.1.0-beta3)

8 files, 262144Kb each, 2048Mb total
Creating files for the test...
Extra file open flags: (none)
Creating file test_file.0
Creating file test_file.1
Creating file test_file.2
Creating file test_file.3
Creating file test_file.4
Creating file test_file.5
Creating file test_file.6
Creating file test_file.7
2147483648 bytes written in 1.62 seconds (1266.23 MiB/sec).
% ls
test_file.0	test_file.1	test_file.2	test_file.3	test_file.4	test_file.5	test_file.6	test_file.7
# Run
% sysbench fileio --file-test-mode=seqwr --file-num=8 --threads=8 run
sysbench 1.0.20 (using system LuaJIT 2.1.0-beta3)
Running the test with following options:
Number of threads: 8
Initializing random number generator from current time
Extra file open flags: (none)
8 files, 256MiB each
2GiB total file size
Block size 16KiB
Periodic FSYNC enabled, calling fsync() each 100 requests.
Calling fsync() at the end of test, Enabled.
Using synchronous I/O mode
Doing sequential write (creation) test
Initializing worker threads...
Threads started!
File operations:
reads/s: 0.00
writes/s: 137555.28
fsyncs/s: 11010.43
Throughput:
read, MiB/s: 0.00
written, MiB/s: 2149.30
General statistics:
total time: 10.0010s
total number of events: 1485913
Latency (ms):
min: 0.00
avg: 0.05
max: 242.62
95th percentile: 0.10
sum: 79354.18
Threads fairness:
events (avg/stddev): 185739.1250/3375.82
execution time (avg/stddev): 9.9193/0.00
# Cleanup

% sysbench fileio cleanup
sysbench 1.0.20 (using system LuaJIT 2.1.0-beta3)

Removing test files...

% ls
% -
AWS4 years ago
How to install NodeJS in Amazon Linux 2
-
AWS3 years ago
How to install .Net 6 in Amazon Linux 2
-
Uncategorized3 years ago
How to install Docker in Amazon Linux 2?
-
Infrastructure4 years ago
How to get Linux OS Information using uname command
-
Infrastructure3 years ago
How to reproduce CVE-2021-44228 (Log4J vulnerability), patch it, and validate the fix
-

 Uncategorized3 years ago
Everything, Everywhere, All At Once
-
Linux3 years ago
How to install git in Amazon Linux 2
-
Infrastructure4 years ago
Getting started with Terraform CDK and TypeScript